- May 18, 2021
- By Ismael Christian
Master Techniques for Efficient Use of Stata
Stata is a useful statistical software package that keeps data in memory..
read more
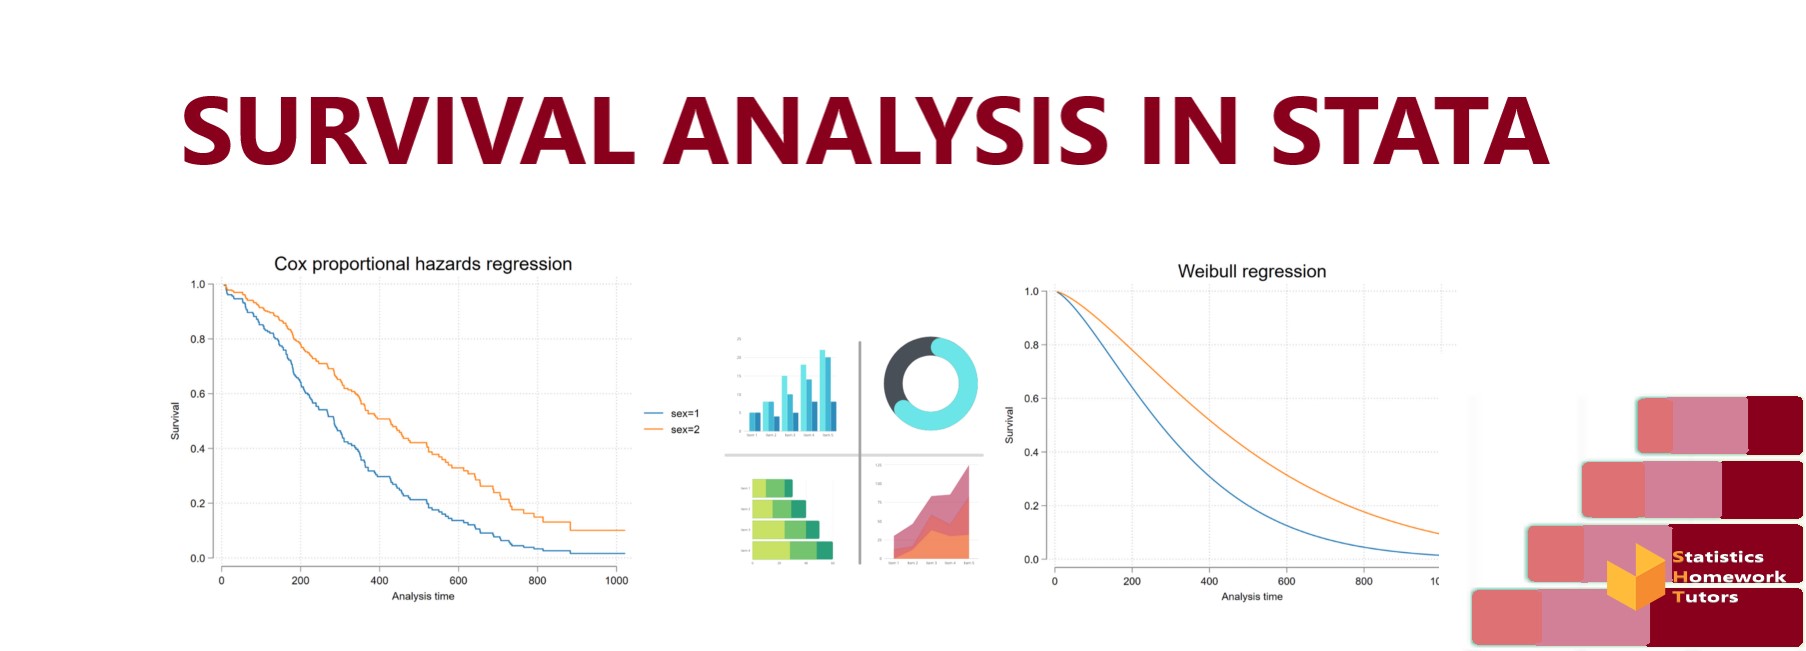
Survival Analysis is defined as a branch of statistics for evaluating the expected duration until an event occurs. It can be a failure of a mechanical system or the death of biological organisms. Survival Analysis gets different names in other fields. For instance, in engineering it's known as reliability analysis, in sociology it is known as event history analysis and in economics, it's known as duration modeling.
It is useful in many areas. For instance, in the COVID -19 pandemic, Survival Analysis can be used to evaluate the proportion of a population that is likely to survive past the COVID-19 period. It will also be able to answer questions such as at what rate will these people die or fail. It would also analyze at what circumstances will this increase or lower their chance of survival.
If you want to conduct a Survival Analysis in STATA, you must be aware of certain things that will be mentioned in this article.
The Kaplan Meier approach is also known as the product limit approach that re-estimates the survival probability every time an event takes place. This popular nonparametric method fails to assume the distribution of a certain outcome variable which in this instance is time. Stata offers various commands for non-parametric analysis involving survival data that can produce tables, inferences, and statistics.
An individual can use their sts graph command to get a K-M plot. In Stata, sts is a powerful command that is used to achieve nonparametric estimates. You can equally use the risk table commands that will generate a risk table underneath this plot. If a curve is witnessed it will show that there are survival probability changes over a certain time horizon.
The second step is using the Cox-PH model which is a semi-parametric model that seeks to solve issues of incorporating covariates. In the Cox proportion hazard model, the log hazard is viewed as a population level baseline hazard and a linear function of the covariates.
The next step would be to look at the accelerative failure time (AFT) model. This model assumes that the survival function uses a parametric continuous distribution. An individual can use log-normal distribution or Weibull.
Hope this article has been educative on ways in which you can use Survival Analysis in STATA.
Stata is a useful statistical software package that keeps data in memory..
read more
Minitab software is essential as it assists companies and institutions to solve problems..
read more
MINITAB has released a new version of its software that has exciting features that..
read more